
TopInG: Topologically Interpretable Graph Learning via Persistent Rationale Filtration
Published in 42nd International Conference on Machine Learning (ICML), 2025
Abstract
Graph Neural Networks (GNNs) have shown remarkable success across various scientific fields, but their adoption in critical decision-making is often hindered by a lack of interpretability. Recently, intrinsically interpretable GNNs have been developed to provide insights into model predictions by identifying “rationale” substructures in graphs. However, existing methods struggle when these underlying rationale subgraphs are complex and varied in their structure.
To address this, we propose TopInG: Topologically Interpretable Graph Learning, a novel framework that leverages persistent homology to identify stable and meaningful rationale subgraphs. TopInG uses a rationale filtration learning approach to model the generation of these subgraphs. We introduce a self-adjusting topological constraint, which we term topological discrepancy, to enforce a clear and persistent topological distinction between the crucial rationale subgraphs and irrelevant parts of the graph. We provide theoretical guarantees that our loss function is uniquely optimized by the ground truth under specific conditions. Extensive experiments show that TopInG effectively handles variform rationales, balances predictive performance with interpretability, and mitigates spurious correlations, outperforming state-of-the-art methods in both prediction accuracy and interpretation quality.
The Challenge: Variform Rationales
Existing interpretable GNNs struggle with variform rationale subgraphs—explanatory substructures that vary significantly in shape, size, and topology within the same class. We created the BA-HouseOrGrid-nRnd dataset to test this challenge. As rationale complexity increases, existing methods degrade sharply while TopInG maintains stable performance.
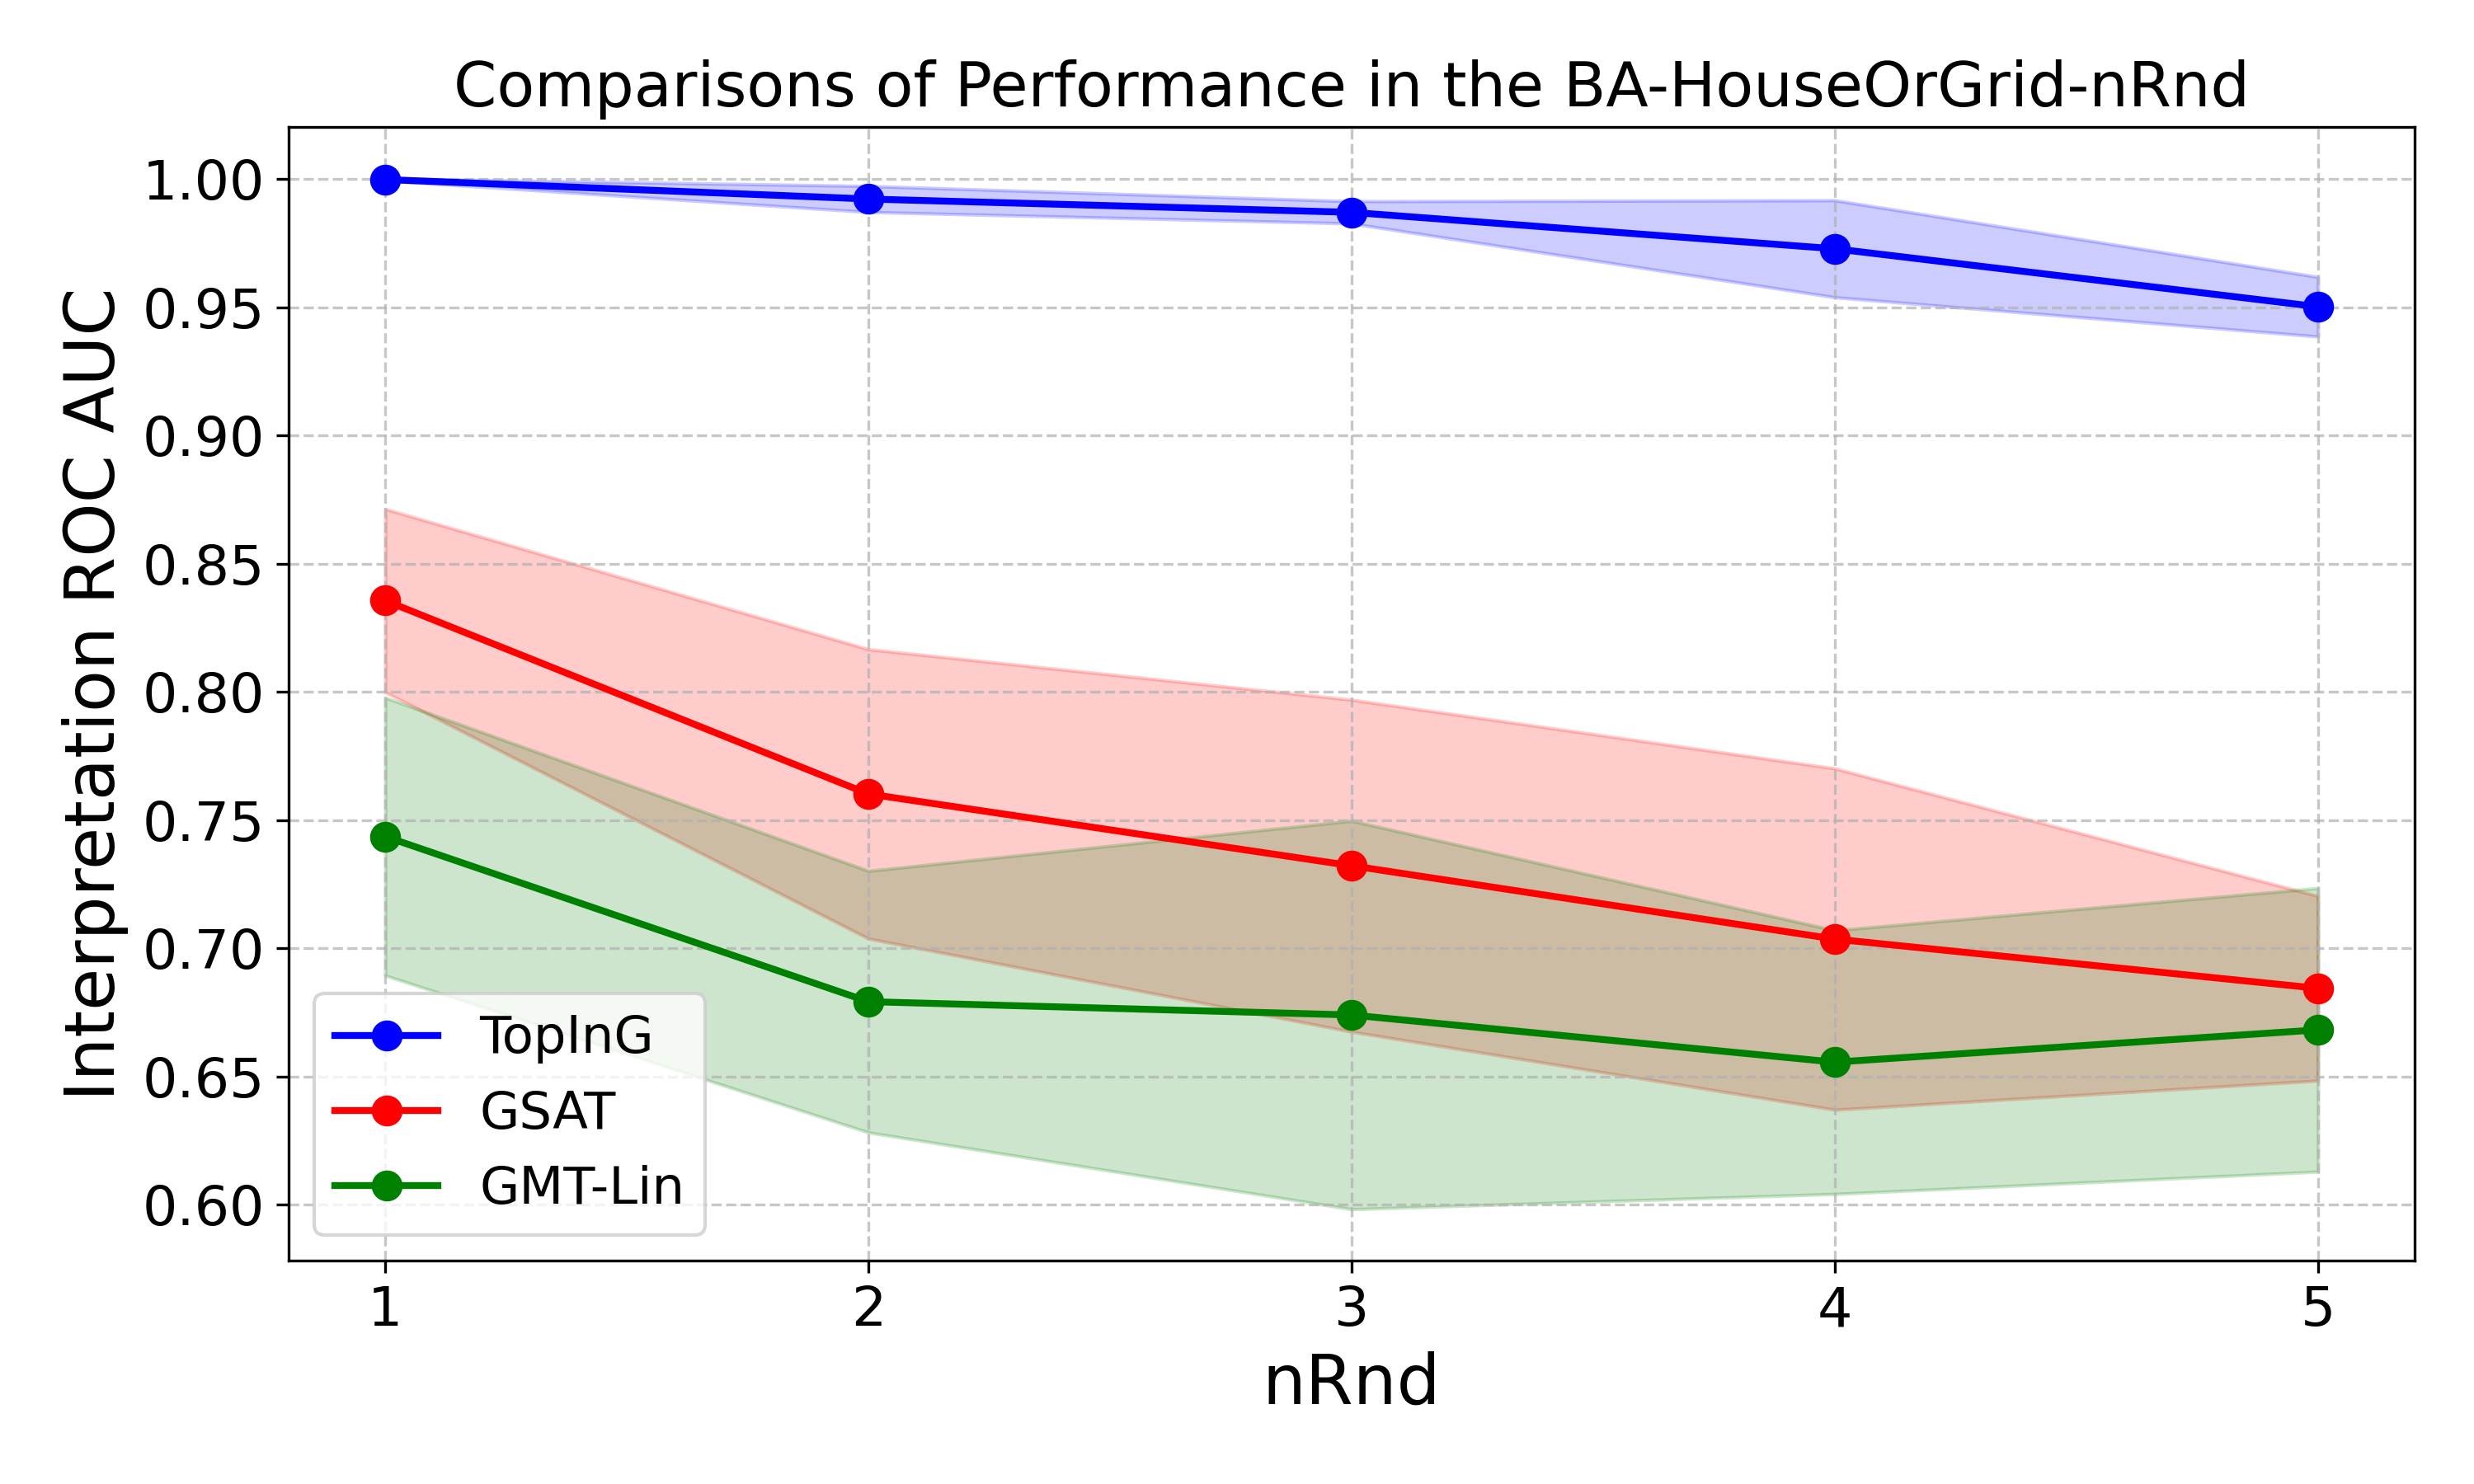
Figure 1: As rationale complexity (nRnd) increases, TopInG maintains high interpretation performance (ROC AUC) while other methods degrade significantly.
Our Method: Persistent Rationale Filtration
TopInG learns an optimal “filtration”—an ordered edge sequence based on importance. We first construct the rationale subgraph (GX), then add remaining edges (Gε). Persistent homology analyzes topological features that emerge during this process.
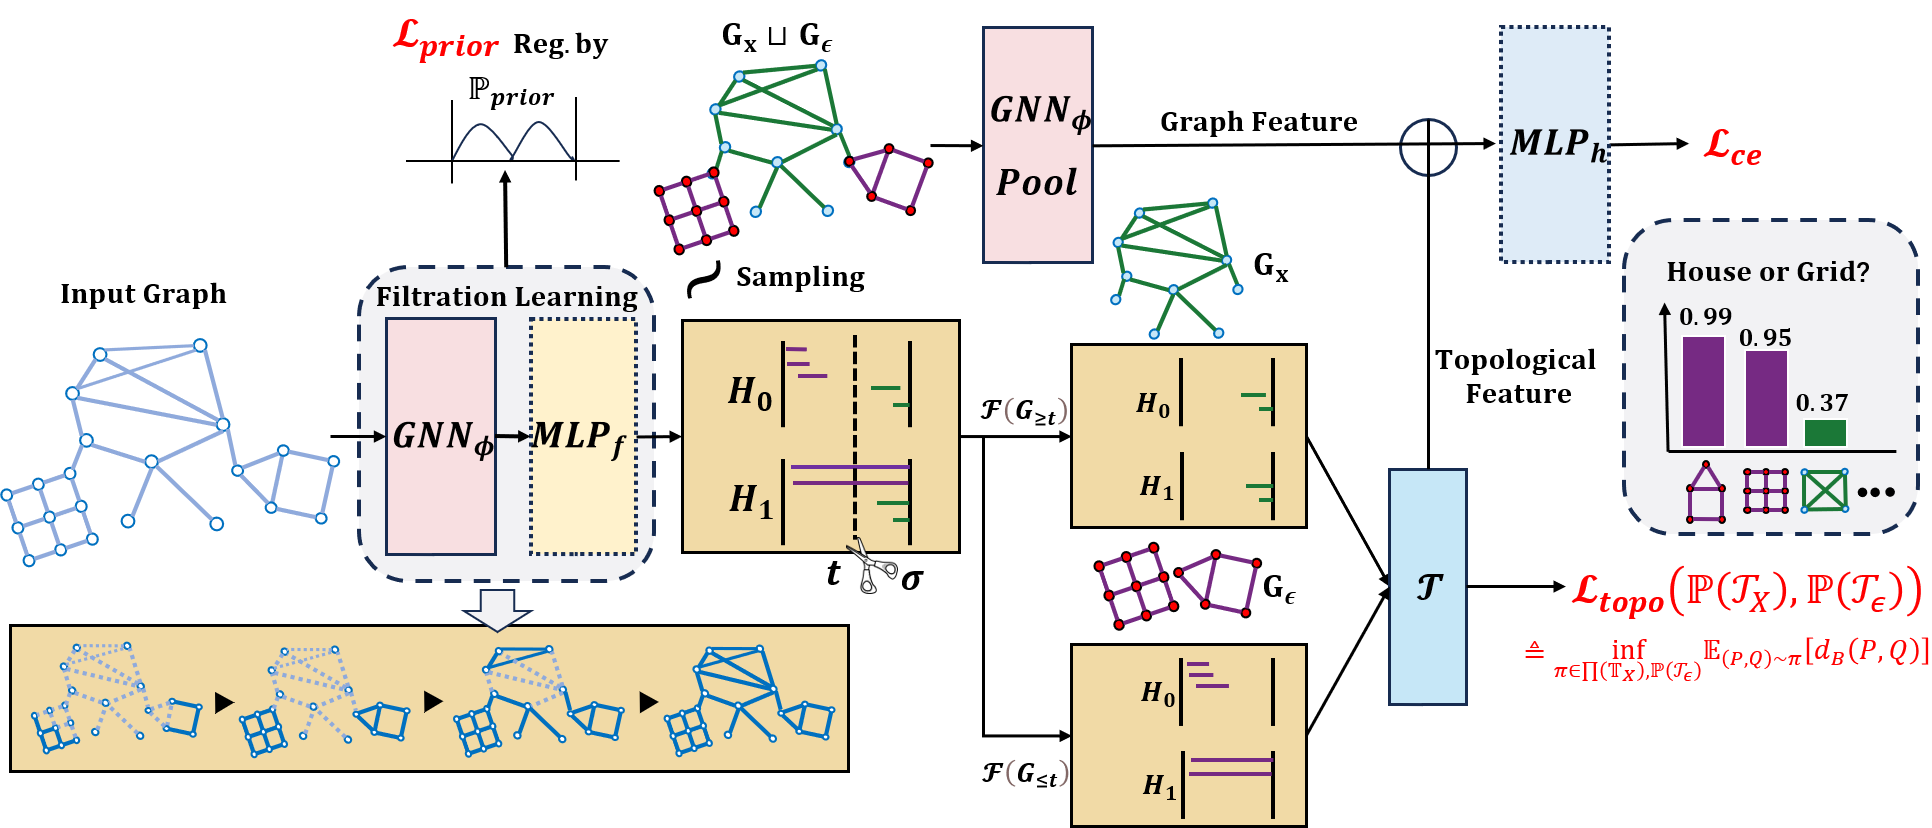
Figure 2: An overview of the TopInG framework.
Our key innovation is the topological discrepancy loss that maximizes differences between rationale and complement topological signatures, creating a clear “persistent homology gap.”
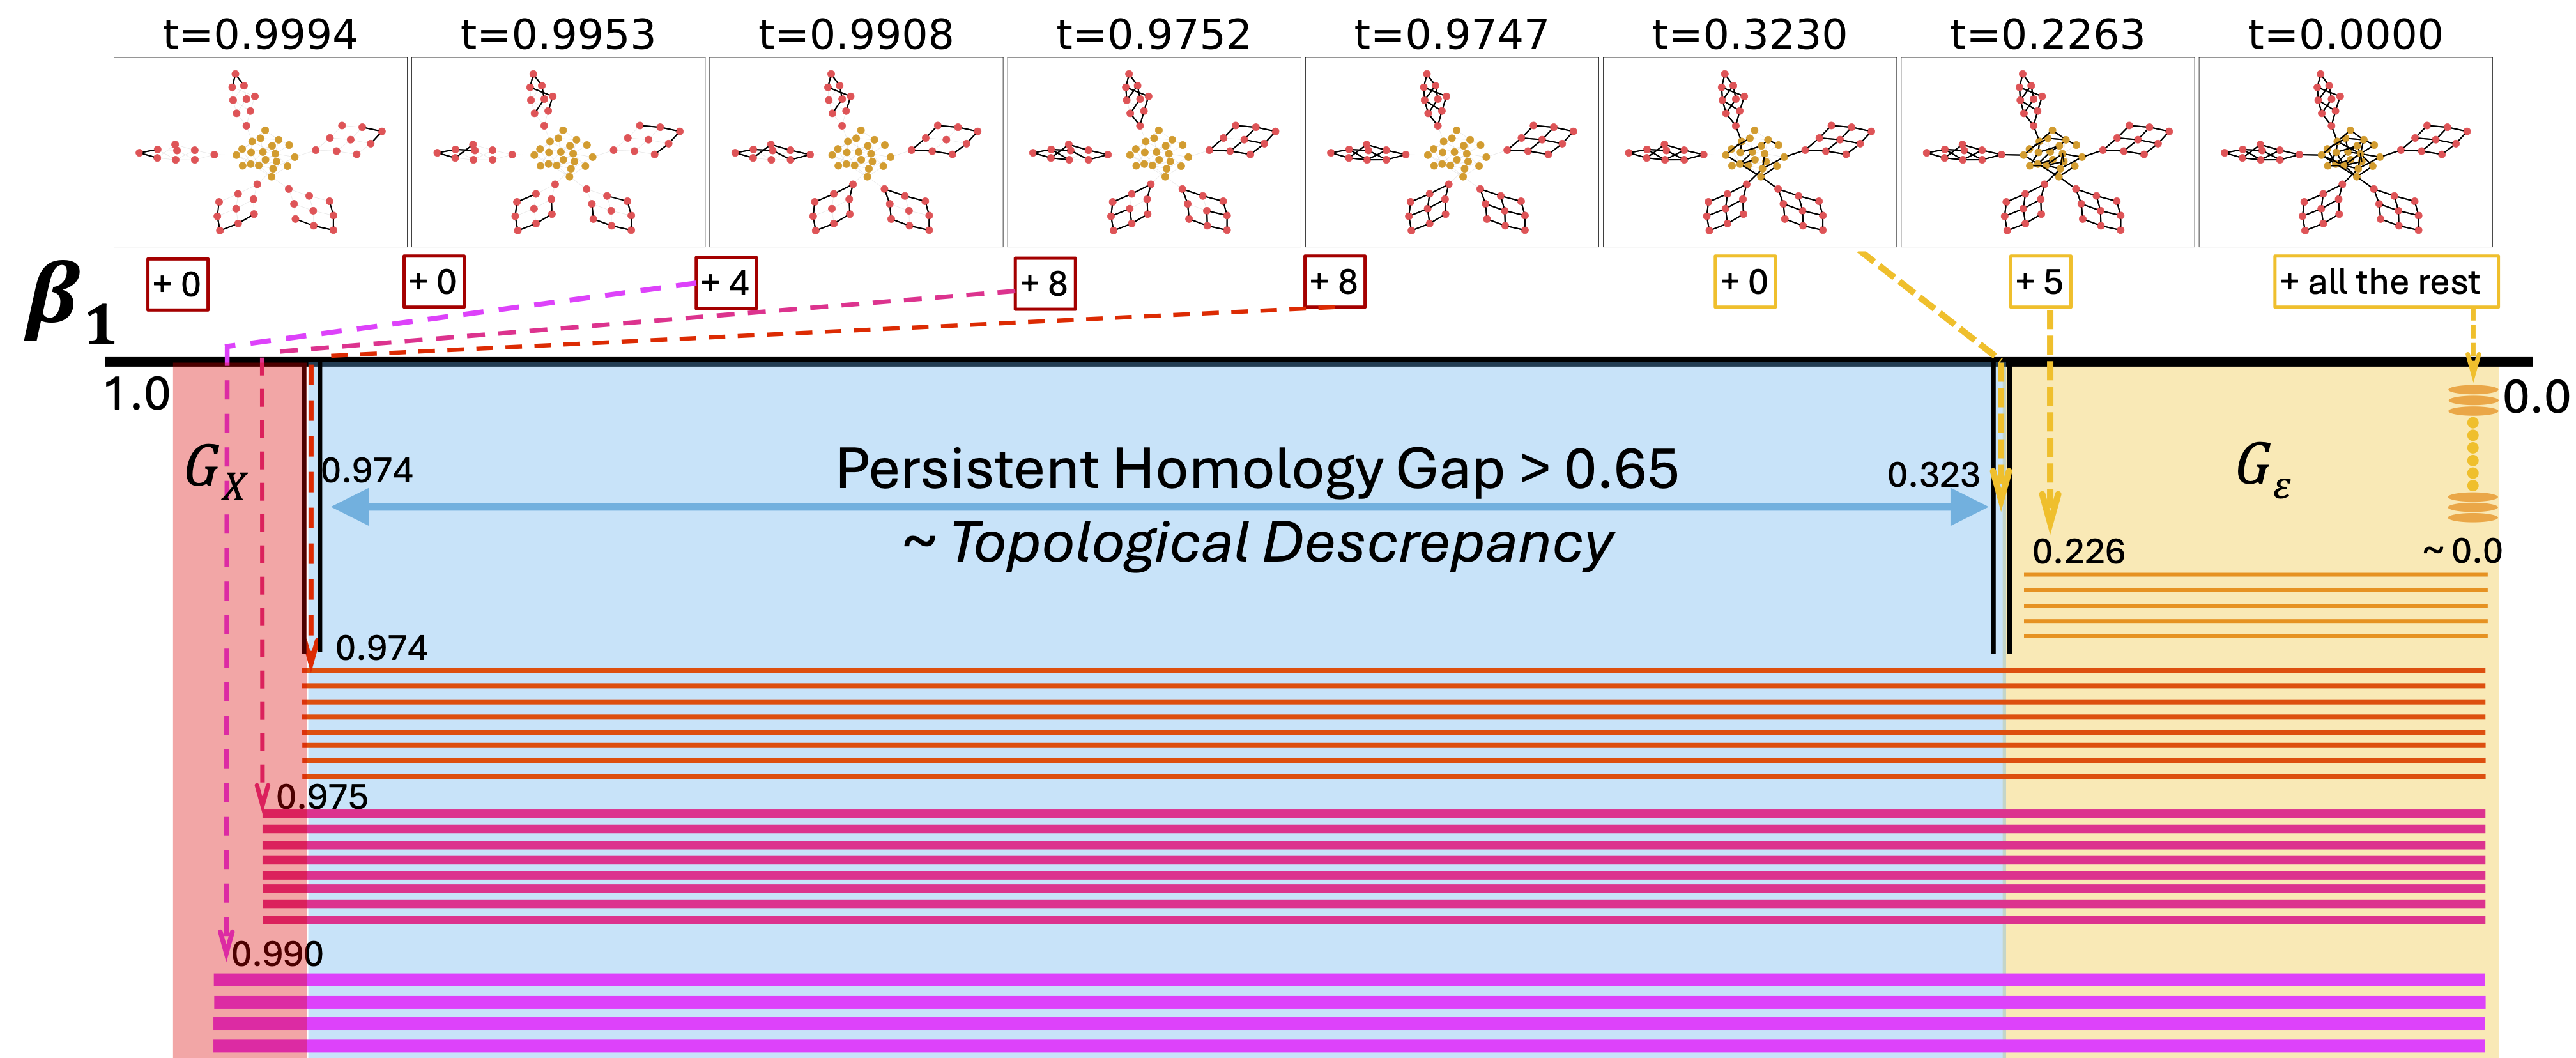
Figure 3: Persistent homology barcode showing the topological discrepancy between rationale and complement subgraphs.
Experimental Results
We evaluated TopInG on eight benchmark datasets against leading interpretation methods, achieving new state-of-the-art results in both interpretation quality and predictive accuracy.
Interpretation Performance (AUC)
TopInG consistently identifies correct rationale subgraphs with higher fidelity. With the CINpp backbone, TopInG achieves perfect scores on challenging datasets.
Table 1: Interpretation Performance (AUC) on Test Datasets
| Method | BA-2Motifs | BA-HouseGrid | SPmotif0.5 | SPMotif0.9 | BA-HouseAndGrid | BA-HouseOrGrid | Mutag | Benzene |
|---|---|---|---|---|---|---|---|---|
| GNNExplainer | 67.35 ± 3.29 | 50.73 ± 0.34 | 62.62 ± 1.35 | 58.85 ± 1.93 | 53.04 ± 0.38 | 53.21 ± 0.36 | 61.98 ± 5.45 | 48.72 ± 0.14 |
| PGExplainer | 84.59 ± 9.09 | 50.92 ± 1.51 | 69.54 ± 5.64 | 72.34 ± 2.91 | 10.36 ± 4.37 | 3.14 ± 0.01 | 60.91 ± 17.10 | 4.26 ± 0.36 |
| MatchExplainer | 86.06 ± 28.37 | 64.32 ± 2.32 | 57.29 ± 14.35 | 47.29 ± 13.39 | 81.67 ± 0.48 | 79.87 ± 1.61 | 91.04 ± 6.59 | 55.65 ± 1.16 |
| Mage | 79.81 ± 2.27 | 82.69 ± 4.78 | 76.63 ± 0.95 | 74.38 ± 0.64 | 99.95 ± 0.06 | 99.93 ± 0.07 | 99.57 ± 0.47 | 96.03 ± 0.63 |
| Intrinsic Methods | ||||||||
| DIR | 82.78 ± 10.97 | 65.50 ± 15.31 | 78.15 ± 1.32 | 49.08 ± 3.66 | 64.96 ± 14.31 | 59.71 ± 21.56 | 64.44 ± 28.81 | 54.08 ± 13.75 |
| GIN+GSAT | 98.85 ± 0.47 | 98.55 ± 0.59 | 74.49 ± 4.46 | 65.25 ± 4.42 | 92.92 ± 2.03 | 83.56 ± 3.57 | 99.38 ± 0.25 | 91.57 ± 1.48 |
| GIN+GMT-Lin | 97.72 ± 0.59 | 85.68 ± 2.79 | 76.26 ± 5.07 | 69.08 ± 5.14 | 76.12 ± 7.47 | 74.36 ± 5.41 | 99.87 ± 0.09 | 83.90 ± 6.07 |
| GIN+TopInG | 99.57* ± 0.60 | 99.24* ± 0.66 | 79.50 ± 3.71 | 80.82* ± 4.22 | 95.35 ± 0.95 | 88.56 ± 2.04 | 95.79 ± 1.93 | 98.22* ± 0.92 |
| CINpp Backbone | ||||||||
| CINpp+GSAT | 91.12 ± 4.93 | 91.04 ± 6.59 | 78.20 ± 4.48 | 80.24 ± 3.66 | 95.17 ± 2.46 | 69.30 ± 2.48 | 97.27 ± 0.47 | 95.40 ± 3.05 |
| CINpp+GMT-Lin | 91.03 ± 5.24 | 93.68 ± 4.79 | 83.23 ± 4.30 | 76.40 ± 2.38 | 85.08 ± 3.85 | 67.91 ± 5.10 | 97.48 ± 0.81 | 94.44 ± 2.49 |
| CINpp+TopInG | 100.00* ± 0.00 | 99.87* ± 0.13 | 95.08* ± 1.84 | 92.82* ± 2.45 | 100.00* ± 0.00 | 100.00* ± 0.00 | 96.38 ± 2.56 | 100.00* ± 0.00 |
*Results are statistically significant and outperform the best baseline.
Prediction Performance (Accuracy)
TopInG achieves higher prediction accuracy, especially with spurious correlations that mislead other models.
Table 2: Prediction Performance (Accuracy) on Test Datasets
| Model | Method | Mutag | Benzene | SpuriousMotif (b=0.5) | SpuriousMotif (b=0.7) | SpuriousMotif (b=0.9) |
|---|---|---|---|---|---|---|
| GIN | DIR | 68.72 ± 2.51 | 50.67 ± 0.93 | 45.49 ± 3.81 | 41.13 ± 2.62 | 37.61 ± 2.02 |
| GIN | GSAT | 98.28 ± 0.78 | 100.00 ± 0.00 | 47.45 ± 5.87 | 43.57 ± 2.43 | 45.39 ± 5.02 |
| GIN | GMT-Lin | 91.20 ± 2.75 | 100.00 ± 0.00 | 51.16 ± 3.51 | 53.11 ± 4.12 | 47.60 ± 2.06 |
| GIN | TopInG | 94.20 ± 5.61 | 100.00 ± 0.00 | 52.22 ± 2.07 | 54.46 ± 5.76 | 50.21 ± 3.22 |
| CINpp Backbone | ||||||
| CINpp | GSAT | 96.14 ± 0.67 | 99.43 ± 0.54 | 74.70 ± 3.37 | 70.41 ± 3.44 | 65.90 ± 4.18 |
| CINpp | GMT-Lin | 95.27 ± 1.36 | 98.87 ± 0.92 | 73.16 ± 3.51 | 69.11 ± 4.12 | 68.60 ± 6.06 |
| CINpp | TopInG | 92.92 ± 7.02 | 100.00* ± 0.00 | 79.30* ± 3.92 | 75.46* ± 4.62 | 77.68* ± 4.64 |
*Results are statistically significant and outperform the best baseline.
Key Contributions
- Novel Framework: First to leverage persistent homology for graph interpretability
- Theoretical Guarantees: Topological discrepancy loss uniquely optimized by ground truth
- Superior Performance: State-of-the-art interpretation quality and predictive accuracy
- Robustness: Handles variform rationales and spurious correlations
BibTeX Citation:
@inproceedings{xin2025toping,
  title={TopInG: Topologically Interpretable Graph Learning via Persistent Rationale Filtration},
  author={Cheng Xin and Fan Xu and Xin Ding and Jie Gao and Jiaxin Ding},
  booktitle={International Conference on Machine Learning},
  year={2025},
  url={https://openreview.net/forum?id=u4LlYWJHUF}
}
Links
| Paper | Poster | BibTeX |